Table of Contents
Why Choosing the Right Traders to Copy Matters
Define Your Investment Goals Before Choosing a Trader
How to Evaluate Copy Trading Performance Metrics
Qualitative Factors to Consider Before Copying a Trader
How to Diversify Your Copy Trading Portfolio
Using TradeQuo's Copy Trading Tools to Compare Traders
Build a Smarter Copy Trading Portfolio
Frequently Asked Questions
Why Choosing the Right Traders to Copy Actually Matters
Knowing how to choose traders to copy is the single most important decision you will make as a copy trader. The whole appeal of copy trading is that you get to delegate the execution to someone with experience while you benefit from their results. But that hands-off convenience comes with a catch: if you follow the wrong trader, you absorb their losses just as automatically as their gains. It is not enough to look at a shiny return figure at the top of a leaderboard and click follow. The most successful copy traders treat provider selection like a due diligence process, examining the numbers behind the numbers, understanding the strategy, and making sure the risk profile actually fits their own financial goals.
Define Your Objectives Before You Look at a Single Profile
Before you open a single trader profile, you need to be honest with yourself about what you are actually trying to achieve. Copy trading can serve very different goals, and the type of trader who fits one objective can be completely wrong for another. Skipping this step is one of the most common copy trading mistakes to avoid.
Start by asking: Are you looking for aggressive growth, or do you want steadier, more predictable returns? A trader chasing high monthly returns is likely taking on significantly more risk, employing higher leverage, and accepting wider swings in portfolio value. That can work beautifully in a bull run and devastate an account in choppy or bearish conditions. A more conservative provider might post modest but consistent gains across different market environments, which may align better with a longer investment horizon or lower risk tolerance.
Equally important is understanding your drawdown tolerance. Drawdown refers to the peak-to-trough decline in a trading account before a new peak is reached. Some traders are comfortable watching their balance drop 20 percent temporarily if they trust the strategy will recover. Others find anything beyond 10 percent psychologically difficult to sit with. Neither is wrong, but you need to know your threshold before you evaluate a provider, not after you are already copying them during a losing streak.
Also, think about your time horizon. Are you planning to copy a trader for three months or three years? Short-term traders who scalp the market multiple times a day may show dazzling short-term results that do not hold up over longer periods. Swing traders who hold positions for days or weeks tend to show more meaningful long-term track records. Clarifying your timeframe, your risk appetite, and your return expectations gives you a filter that cuts through marketing noise and focuses you on providers who genuinely fit your situation.
Copy Trading Performance Metrics: What the Numbers Are Really Telling You
Numbers are the most objective part of evaluating any copy trading provider, but they require context to be useful. Here is a breakdown of the key copy trading performance metrics and how to interpret each one honestly.
Total Return and Annualised Return
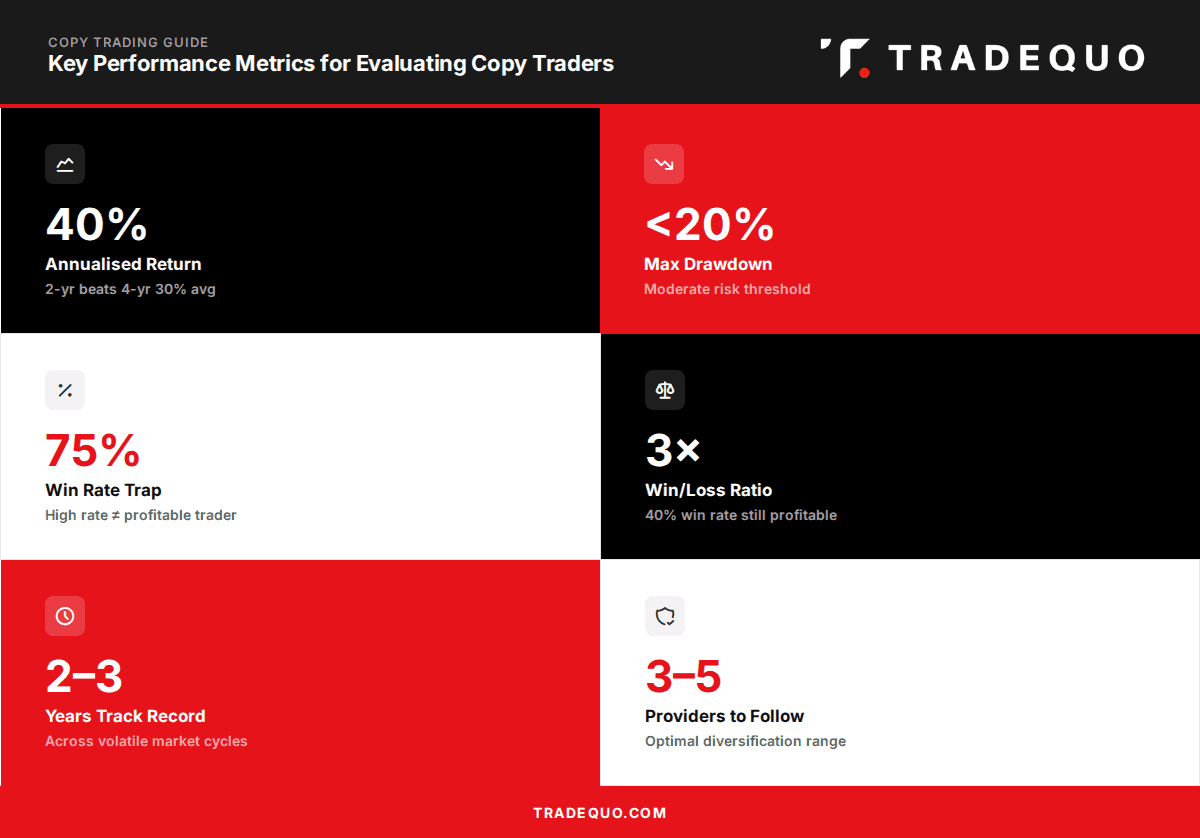
Total return tells you how much a trader has made over their entire tracked history on a platform. Annualised return standardises that figure to a yearly rate, which makes comparison across traders with different account ages much more meaningful. A trader showing 120 percent total return sounds impressive until you realise it was earned over four years, producing a 30 percent annualised return. Another showing 80 percent over two years is annualising at 40 percent and is outperforming. Always compare annualised figures, not raw totals.
Win Rate and Win/Loss Ratio
Win rate refers to the percentage of trades closed at a profit. What is a good win rate in copy trading? That depends almost entirely on the average size of wins versus losses. A trader with a 40 percent win rate can still be highly profitable if their average winning trade is three times larger than their average losing trade. Conversely, a trader boasting a 75% win rate can still lose money overall if they cut winners short and let losses run. This is why the win rate should always be read alongside the profit factor and/or risk-reward ratio, never in isolation.
Maximum Drawdown
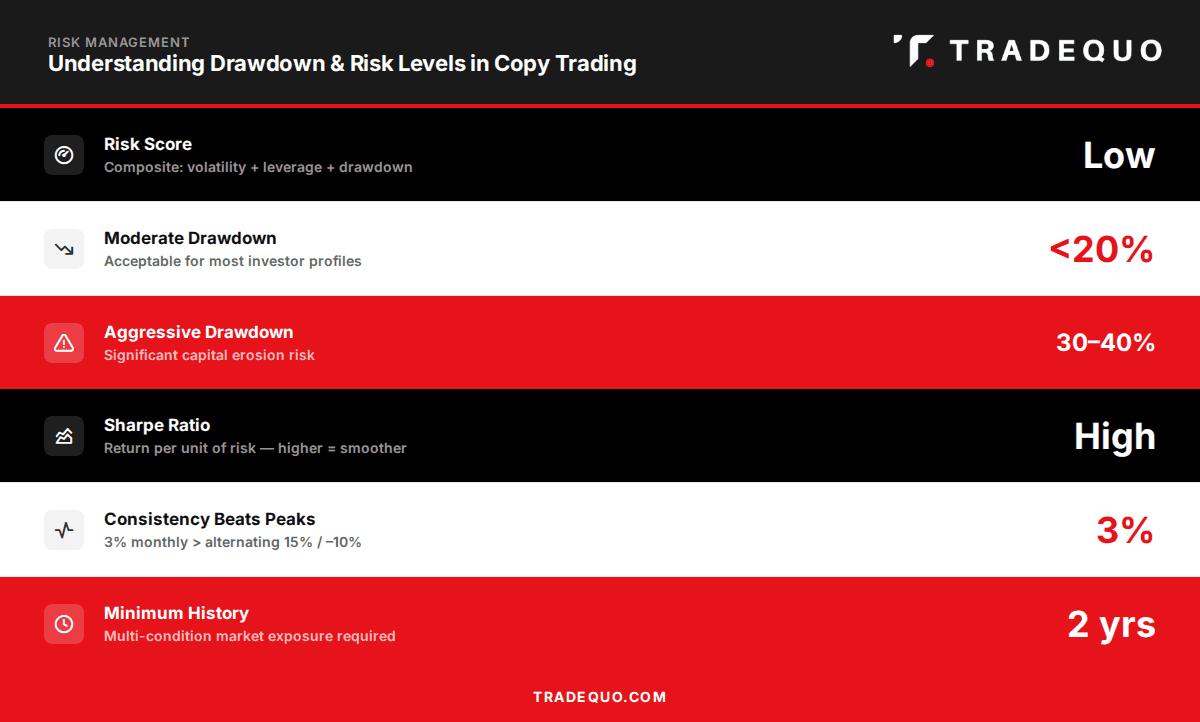
Understanding how to analyze trader drawdown is arguably the most important skill in evaluating copy trading providers. Maximum drawdown measures the largest percentage decline from a peak balance to a trough before recovery. It is a direct window into worst-case scenario risk. What is a good drawdown in copy trading? As a general benchmark, providers with maximum drawdowns below 20 percent are considered moderate risk, while those above 30 to 40 percent suggest aggressive trading styles that can result in significant capital erosion during losing periods. Always ask yourself: if this drawdown happened again tomorrow, could I financially and emotionally handle it?
Risk Score
Many copy trading platforms assign a risk score to each provider based on historical volatility, leverage usage, and drawdown patterns. Think of it as a composite indicator of how aggressively the trader operates. Higher risk scores do not mean a trader is bad, but they signal that you should expect more volatility and ensure that allocation to that provider is sized accordingly within your broader portfolio. Newer traders often make the mistake of chasing the highest-return profiles without checking the risk score that accompanies those returns.
Trade Frequency and Average Holding Time
Trade frequency and average holding time reveal a trader's style and how their results were generated. A scalper opening and closing dozens of positions per day operates very differently from a position trader holding for weeks. High-frequency trading can generate impressive short-term statistics, but it is also more sensitive to spreads, slippage, and platform conditions. Longer average holding times often correlate with more strategic, fundamentals-driven approaches. Neither style is inherently superior, but they carry different operational risks and should match your expectations for account activity.
Sharpe Ratio and Consistency
Where available, the Sharpe ratio is a powerful metric for assessing risk-adjusted return. It measures how much return a trader generates for each unit of risk taken. A higher Sharpe ratio means smoother, more consistent performance. Consistency itself matters enormously: a trader who earns 3% every month is far more valuable to a portfolio than one who alternates between 15 percent gains and 10 percent losses, even if the average return ends up similar. Volatility in returns creates psychological stress and makes it harder to plan your own financial outcomes.
Qualitative Factors: What the Numbers Cannot Show You
Quantitative data is essential, but it only tells part of the story. The qualitative side of evaluating a provider is where you distinguish truly trustworthy traders from those who happen to have gotten lucky during a favorable market window.
Start with the trader's strategy description. Does it actually explain what they do, in plain terms? A credible provider should be able to articulate whether they trade trend-following, mean reversion, breakout strategies, or news-driven positions. They should name the asset classes they focus on, the instruments they prefer, and roughly how they manage risk. Vague descriptions like "proprietary system" with no further detail are a red flag. If a trader cannot or will not explain their edge, that should give you pause.
Communication frequency and transparency are equally revealing. Does the provider post regular updates when market conditions change? Do they acknowledge when a trade did not go as planned and explain what happened? The best traders treat their followers as partners rather than passive observers. Regular, honest communication builds trust and helps you understand whether a period of underperformance is part of a known drawdown phase or something more concerning.
One of the most meaningful qualitative signals is whether a trader is investing their own capital using the same strategy. When a provider has real skin in the game, their interests and yours are aligned. They are not just managing other people's risk while their own account sits in cash. Platforms that show whether the provider trades with their own money offer an important layer of verification that goes beyond performance statistics.
Finally, consider the length and context of the trading history available. A six-month track record that only covers a strong bull market tells you very little about how the trader performs under pressure. A two to three-year history that includes periods of elevated volatility, corrections, or shifts in market regime is far more informative. Look for evidence that the strategy has been tested across different conditions, not just optimized for one favorable period.
Diversification and Portfolio Construction in Copy Trading
One of the most overlooked copy trading tips is treating your collection of followed traders as a portfolio, not a series of independent bets. Concentrating all of your copy trading capital with a single provider, no matter how impressive their track record, exposes you to the full force of any drawdown they experience. A considered approach to how to diversify your copy trading portfolio dramatically reduces that risk.
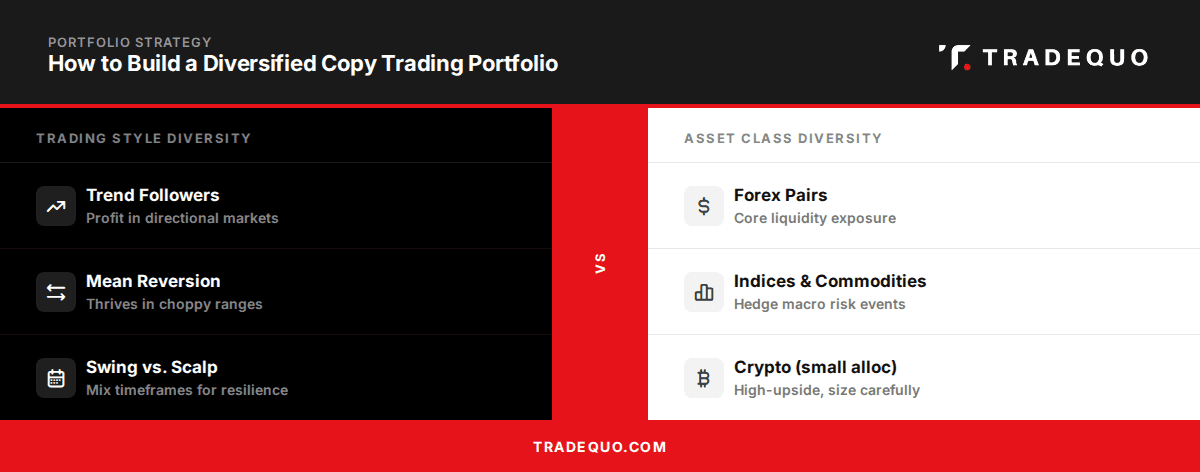
The first principle is diversifying by trading style. Follow a mix of traders who operate on different timeframes and use different analytical approaches. If all your providers are momentum traders who do well in trending markets, your whole portfolio will suffer simultaneously when markets enter a consolidation or reversal phase. Balancing trend followers with mean-reversion traders, or short-term scalpers with longer-term swing traders, creates natural resilience in your overall position.
The second principle is diversifying by asset focus. Traders specializing in forex pairs, indices, commodities, and crypto often respond differently to the same macroeconomic events. A crypto-focused trader may thrive during a risk-on environment, while an index trader hedging with defensive positions holds up better during a selloff. Having exposure to providers across different asset classes means your portfolio is less correlated and more likely to have some positions performing well regardless of the broader environment.
The third principle is sizing allocations to match risk. Providers with higher risk scores or maximum drawdowns should receive smaller allocations relative to lower-risk, more consistent traders. A sensible structure might allocate the majority of your copy trading capital to two or three lower-risk, consistent performers, with smaller allocations to higher-risk, higher-upside providers. This way, even if your aggressive positions underperform, they do not compromise the core stability of your portfolio.
Aim for three to five providers as a starting point. Too few creates concentration risk, while too many dilutes your ability to monitor each provider meaningfully and can result in conflicting positions that cancel each other out.
Using TradeQuo's Tools to Find and Compare Providers
TradeQuo's social trading platform is built around giving followers the information they need to make genuinely informed decisions. Rather than surfacing only top-line return figures, the platform's analytics and filtering tools are designed to support the kind of multi-dimensional evaluation this guide describes.
When you begin searching for providers, TradeQuo's filter system allows you to narrow down candidates based on specific criteria rather than scrolling through an unsorted list. You can filter by performance windows, risk score thresholds, asset class focus, minimum trading history, and other parameters that align directly with the evaluation framework discussed above. This means you spend your time analyzing providers who already meet your baseline requirements rather than manually screening out irrelevant profiles.
Once you have a shortlist, TradeQuo's comparison tools let you view multiple providers side by side across key metrics, including annualised return, maximum drawdown, win rate, risk score, and trade frequency. Seeing these figures in a structured comparison format makes it much easier to spot meaningful differences between providers that look similar at first glance. A trader showing higher returns alongside a dramatically higher drawdown is telling you something important about the risk involved, and the side-by-side view makes that relationship immediately visible.
TradeQuo also provides access to individual trade histories, which allows you to examine how a provider actually behaved during past periods of market stress. Reviewing trades made during periods of high volatility tells you far more about how a trader handles adversity than any summary statistic can. Combined with the platform's transparency features around provider communication and strategy descriptions, these analytics tools give you a comprehensive picture that supports confident, well-reasoned provider selection.
Putting It All Together
Successful copy trading is not about finding the trader with the biggest return figure and pressing follow. It is about building a thoughtful, research-backed relationship with providers whose strategies, risk profiles, and communication styles are genuinely aligned with your own financial goals. That process starts with clarity about what you want, moves through rigorous analysis of both quantitative metrics and qualitative signals, and is reinforced by diversifying intelligently across multiple providers.
No evaluation process eliminates risk. Copy trading, like any form of market participation, involves uncertainty. But the traders who approach provider selection with discipline, ask the right questions, and use every available tool to stress-test a track record before committing capital consistently give themselves better odds of building a copy trading portfolio that actually works. Take your time, trust the framework, and let the data guide your decisions.
FAQs
What should I look for when copy trading?
Focus on key metrics like annualised return, drawdown, risk score, and consistency. Also, check if the trader explains their strategy clearly, communicates regularly, and trades with their own funds. Always match their risk level to your goals.
Is copy trading profitable in 2026?
It can be profitable, but results depend on who you copy and how you manage risk. Choosing reliable traders and diversifying your portfolio significantly improve your chances.
What is a good drawdown in copy trading?
Below 20% is generally a moderate risk. 20–30% is more aggressive. Above 30–40% indicates high risk and potential large losses.
How do you analyze a trader before copying them?
Check long-term performance (ideally 2+ years), review return vs drawdown, risk score, and trading style. Then evaluate their strategy, communication, and behavior during losing periods.
How do you reduce risk in copy trading?
Diversify across 3–5 traders with different styles and assets. Allocate more to stable traders, less to high-risk ones, and monitor performance regularly.